Map + speed and altitude chart track view option
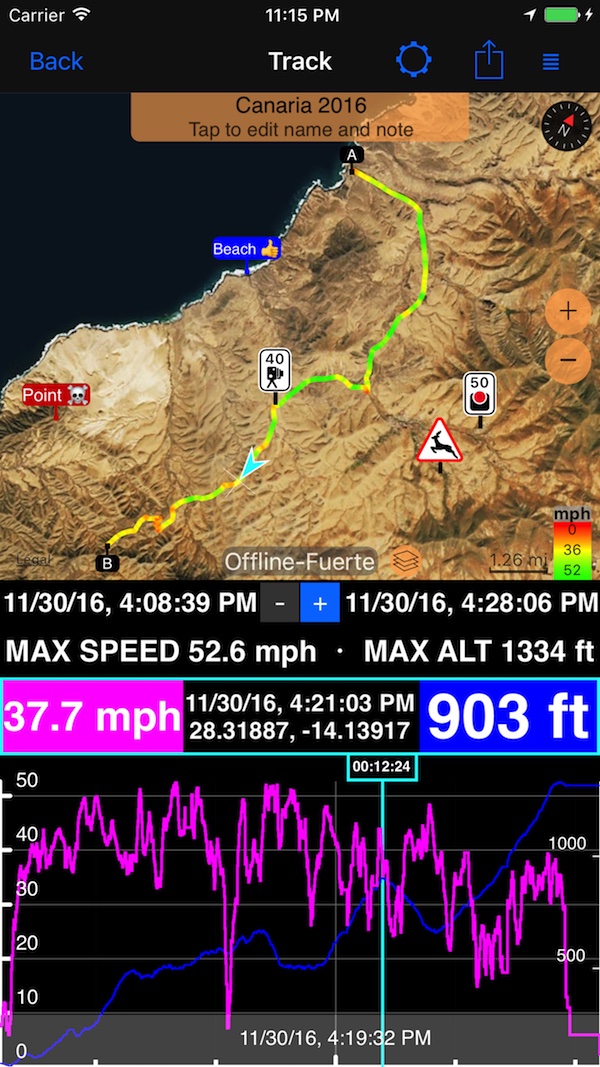
Explore your tracks by viewing them on the map and with support of a chart where you can tap/pan/zoom to focus on the time interval or any point. This is “Map + chart” option (default) in the track viewing screen:
-
Use +/- button in the time span area to zoom in and out the area around the light blue point line.
-
Move the light blue point line to focus on any point in time, light blue arrow on a map also moves to show you the corresponding location on the map.
-
Pan and drag on the chart black area to zoom in and out and focus on the part of the track you are interested in.
-
When chart is zoomed, you can either tap on it to move the light blue point line to the place of your tap or you can use the grey area at the chart bottom to control the light blue point line.
-
Settings button on top of the screen allow to switch between different track views
-
Action button on top allows to share the track in many different ways. We encourage you to try sharing as a “track image”, we tried to create a “postcard” sharing experience for this. Should be looking lovely when sharing via email, Facebook, etc.
-
Grid button top-right allows to either move the track to a different trip or pin it to the main map so you can retrace it.
-
START and END in the track view are buttons that allow you to copy start and end coordinates to a clipboard or create a waypoint.
Related information:
Tracks colored by speed or altitude.
All track view options: “Map + speed and altitude chart” track view option ▪︎ “Map + stats” track view option ▪︎ “Map only” track view option.