Advanced stats - what you kept, when and where you work, which fares pay
At the end of a shift the meter tells you one thing: what your passengers paid. Advanced stats answer the questions that come next — was this month better than the last, what did I actually keep, when and where do my good rides start, and which fares pay best. There is nothing new to log: everything is read from the trips your meter has already saved.
Open MENU > Stats and switch the top of the screen from Classic to Advanced. Classic still has the totals you know ; the app remembers which of the two you used last.
Advanced stats are on iPhone with iOS 26 or later and on Android. The pictures here come from a fictional six-month history of a New York driver, in dollars and miles; your own numbers come from your own trips.
Pick a period
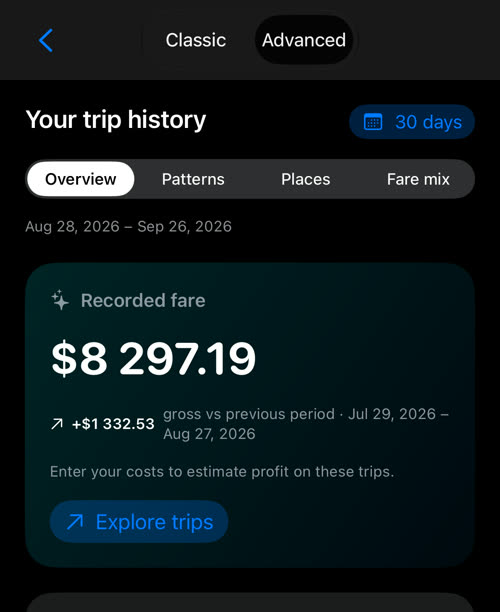
The button at the top right chooses what is counted: Today, 7 days, 30 days, This year, or a single calendar month or year with Choose month… and Choose year….
Below it, four sections: Overview, Patterns, Places and Fare mix. The dates the period covers are printed right under them.
Overview: how did I do?
The headline and the period before
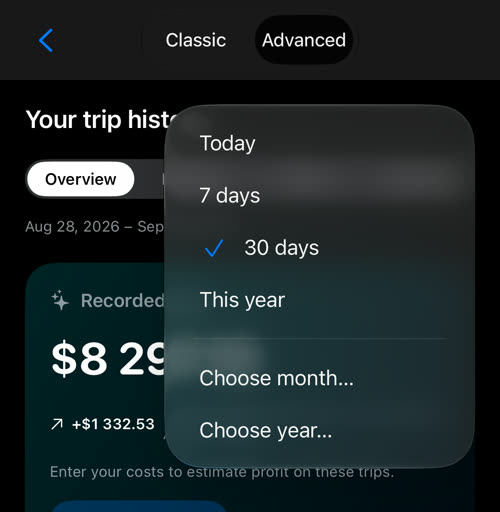
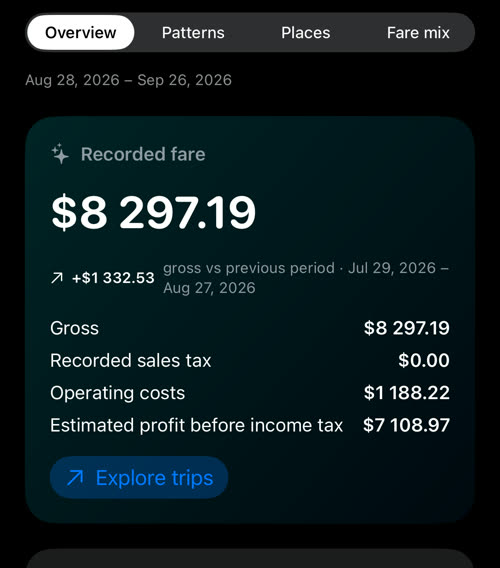
Recorded fare is everything your passengers paid in the period — $8 297.19 over the last 30 days in the example. The line under it compares it with the period just before: +$1 332.53 gross vs previous period, with that period’s dates, so you know which month you are being compared with. A month is compared with the month before, a year with the year before.
Explore trips opens every trip behind the number.
A day and its trips
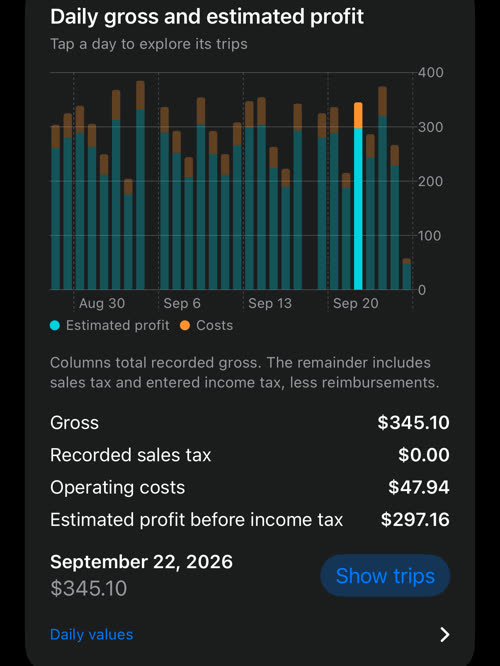
Daily recorded fare draws one column per day. Tap a column and the day’s total appears under the chart; Show trips lists the trips that made it.
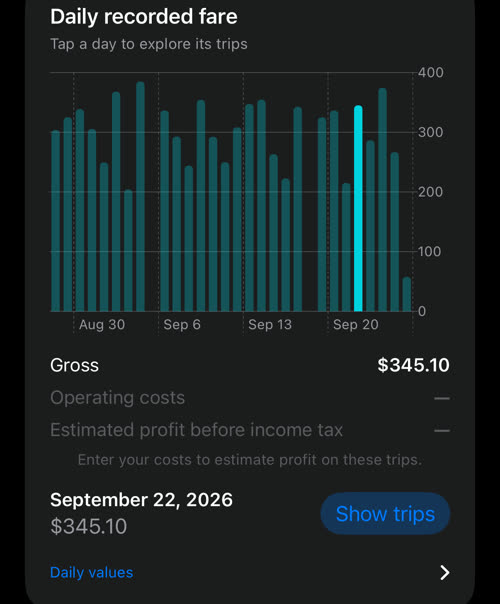
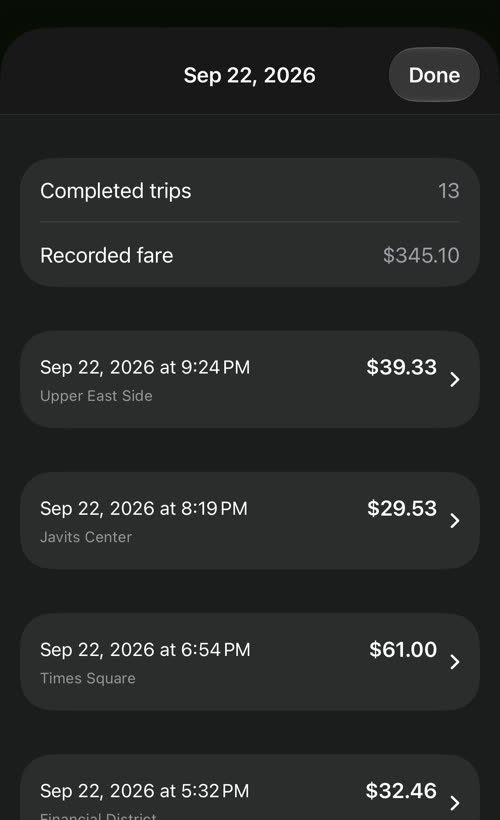
Every number on the screen leads back to real rides like this — nothing is estimated from a sample.
Trips, typical fare, distance, time on the meter
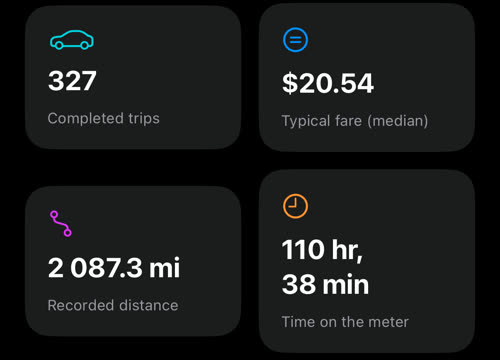
- Completed trips — finished and saved trips in the period.
- Typical fare (median) — the middle fare: half your trips paid less, half paid more. One long airport run does not drag it up the way an average would.
- Recorded distance — miles or kilometres driven with a passenger, as the meter measured them.
- Time on the meter — how long the meter ran on those trips.
Per hour on the meter
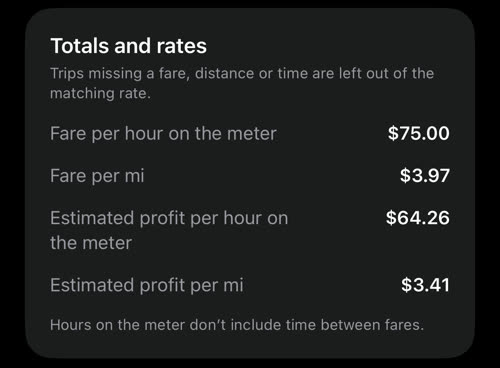
Totals and rates divide the money by that time and distance: Fare per hour on the meter and Fare per mi (or per km).
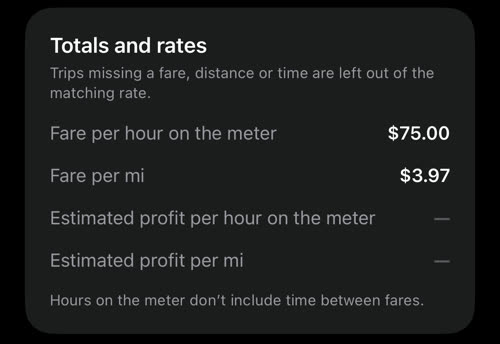
Hours on the meter don’t include time between fares — waiting at a rank, driving to the next job, a break. That is deliberate: the app only knows the time it measured, and it does not guess a shift you may not have told it about. So read the hourly figure as what a meter hour earned, and compare it with itself — this month against last month, one fare against another. If you want the waiting to count, the cost model lets you add extra minutes per trip.
A trip missing a fare, a distance or a time is left out of the matching rate rather than counted as zero.
What did I keep?
What passengers paid is not what you kept. Fuel, the car losing value as the miles add up, the card processor’s cut — the Cost model card is where they go in.
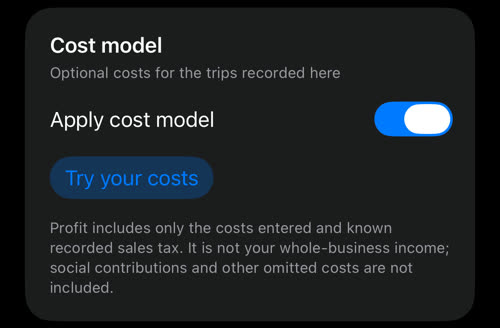
Tap Try your costs, enter only what you know, and close the screen with ✓. The example uses three numbers: running costs of 0.30 a mile, 0.15 a mile for the car’s lost value, and a 3% card fee. Every field and what to put in it is explained on its own page: costs for Advanced stats .
The headline then shows Gross, the Recorded sales tax your meter added (it was never yours, so it comes off too), Operating costs and Estimated profit before income tax:
The daily chart splits each day into estimated profit and costs, and the selected day gets the same breakdown:
And Totals and rates add Estimated profit per hour on the meter and per mile:
This is an estimate, and only as good as the costs you entered: anything you leave out stays out. Profit is before income tax; enter an expected income tax rate and an Estimated income tax row appears, with Estimated profit on recorded trips below it. Either way it is not your whole-business income. Turn Apply cost model off and the screens go back to gross; your costs stay saved for next time.
Patterns: when do I work?
Recorded pickups by time is a grid of weekdays against two-hour windows. The brighter a square, the more of your trips started then. Tap a square to see those trips.
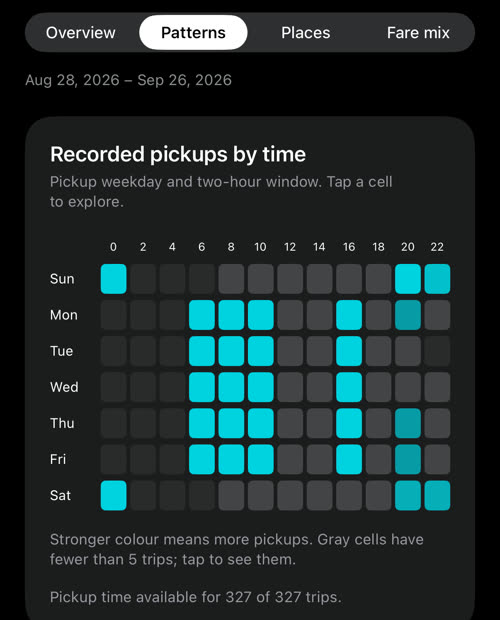
It is a picture of when you worked, not of when the city was busy. Gray squares have fewer than 5 trips — too few to mean much.
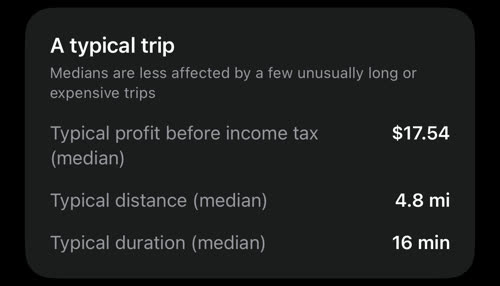
A typical trip gives the middle trip of the period: its estimated profit, its distance and how long it took. Medians again, so a few unusually long or expensive trips do not skew them.
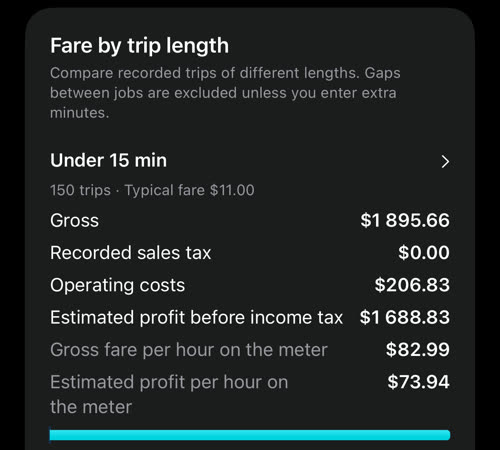
Fare by trip length groups your trips by duration — under 15 minutes, 15–30, 30–60, and an hour or more — each with its gross, costs, profit and hourly rates, so short runs and long ones can be compared on the same terms.
Places: where do my rides start?
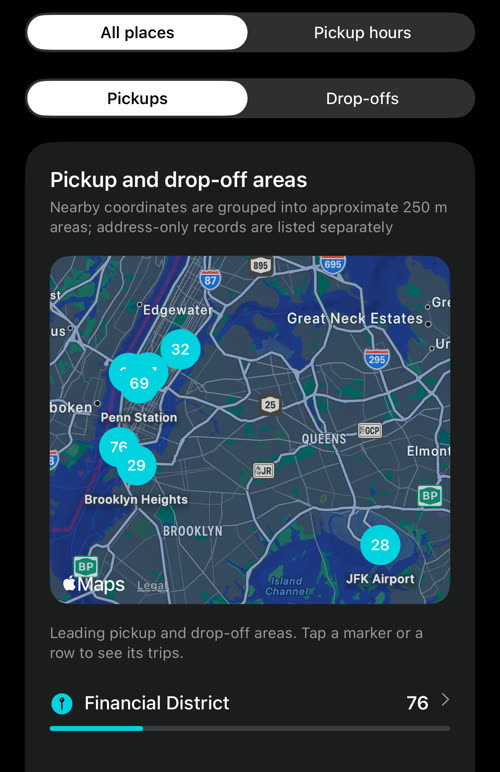
All places shows where your rides start and end, grouped into small areas of about 250 m on a map. Switch between Pickups and Drop-offs; tap a marker or a row for its trips.
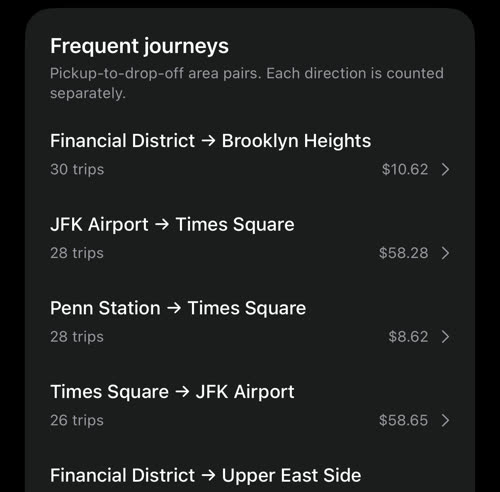
Further down, Frequent journeys lists your most common pickup-to-drop-off pairs. Each direction counts separately, so Times Square → JFK Airport and JFK Airport → Times Square are two rows.
Pickup hours
Choose Pickup hours to ask a sharper question: where did my rides at this hour actually start? Pick the days — All days, Weekdays, Weekends or a single weekday — and an hour, from the menu or by tapping the hour strip.
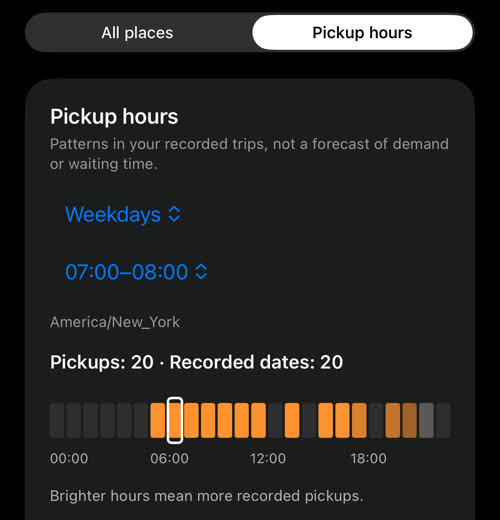
The areas below are where those rides started, and on how many different days — 17 pickups on 17 dates is a place that keeps calling you back; 17 on one day was a one-off. Tap an area for its typical fare and estimated profit per hour, and Explore these pickups for the trips themselves.
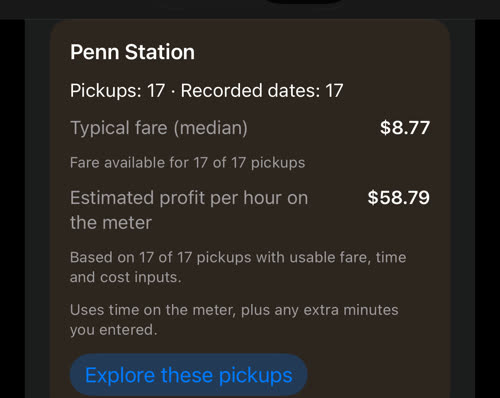
This is your own record, not a forecast of demand or of how long you would wait — but it remembers the hotel door and the station exit better than you will.
Fare mix: which fares pay?
Fare mix puts each of your fares side by side — in the example Day, Night and ✈️Airport — with its trips, gross, costs, estimated profit and rates.
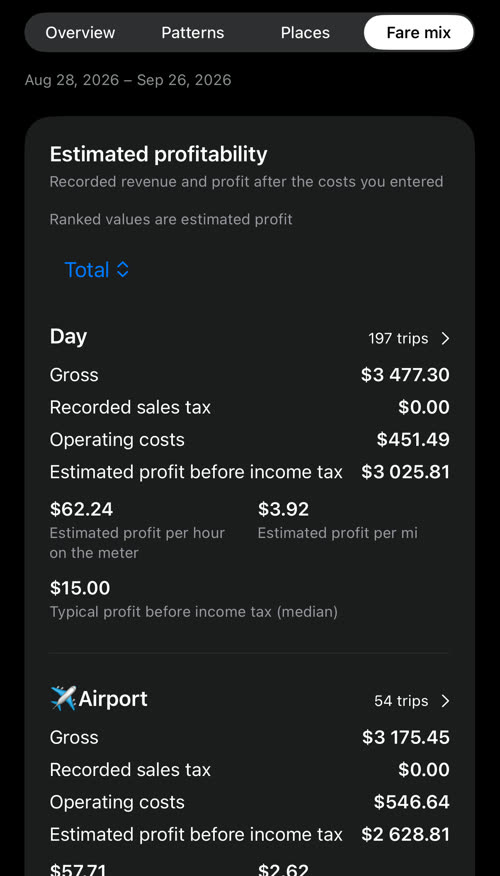
Rank by changes the order: Per hour, Per mi (or Per km), Typical trip or Total. Ranked by the typical trip, the airport run wins easily — it is the biggest fare of the day. Ranked Per hour, the picture turns around:
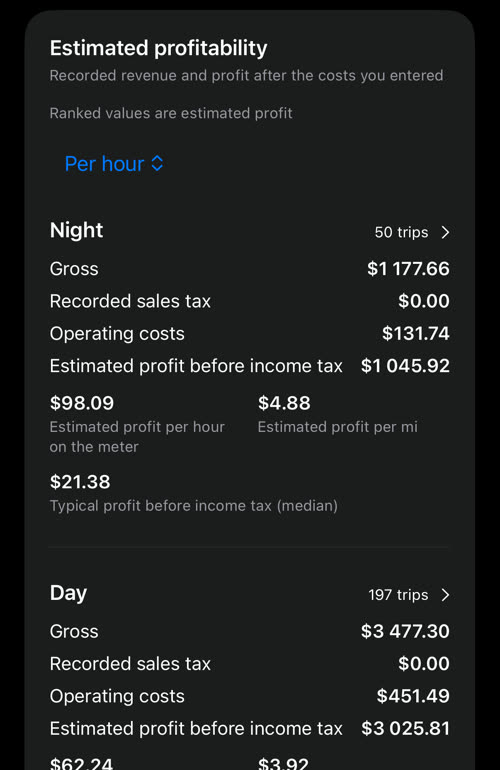
The airport run drops to last and the night fare comes out on top — and that is before the time spent in the airport queue, which the meter never sees. Worth knowing before you join the next one.
The comparison needs enough trips to mean something: until two fares each have at least 5 trips in the period, the rows are listed without a ranking.
Mixed fares
A trip that switched fare while the meter ran — Day into Night at the evening boundary, for example — stays in one piece under Mixed fares. Its money is never guessed or split between fares.
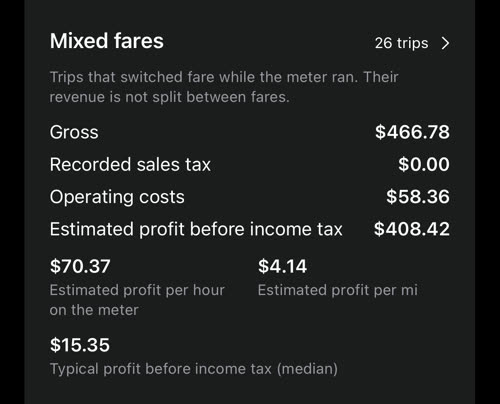
Trips saved without any fare name are listed as Unknown fare.
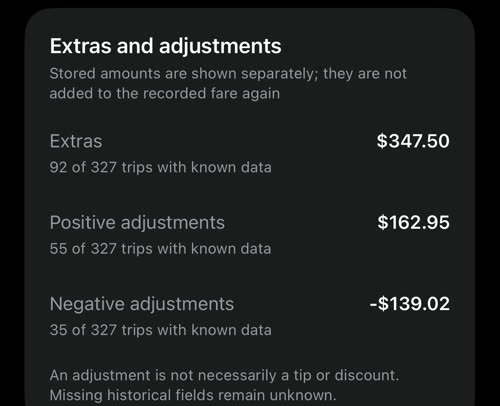
Extras and adjustments
Extras, and the adjustments made to trip totals — for example with Adjust total — are shown on their own. They are already part of the recorded fare, so they are not added again. An adjustment is not necessarily a tip or a discount, and older trips that never stored these amounts stay unknown rather than counting as zero.
What these numbers are — and are not
About these numbers, at the bottom of the Overview, says exactly what was counted:
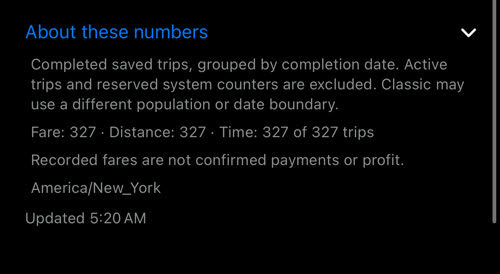
- Only completed, saved trips count, grouped by the day they ended. A trip still running is not included — Advanced stats open once the current trip is ended and cleared.
- Recorded fares are not confirmed payments. They are what the meter charged.
- Profit is an estimate from the costs you entered, before income tax unless you enter an expected rate.
- Hourly rates use time on the meter, not your whole working day.
- Patterns and places are your own history, not a forecast.
- Classic stats may count a slightly different set of trips or cut the days differently, so the two screens do not have to agree to the cent.
On Android
The same screen, under the same Classic and Advanced switch: the same four sections, the same periods, the same cost pages and the same rules for mixed fares. Nothing to learn twice.
More about your records:
Costs for Advanced stats ▪︎ Classic stats ▪︎ Trips log ▪︎ Fare editor ▪︎ Adjust the total ▪︎ Settings backup and restore