Version 6.5 - What's new?
Version 6.5 is about what you do with what you record: before the trip, on the way and afterwards.
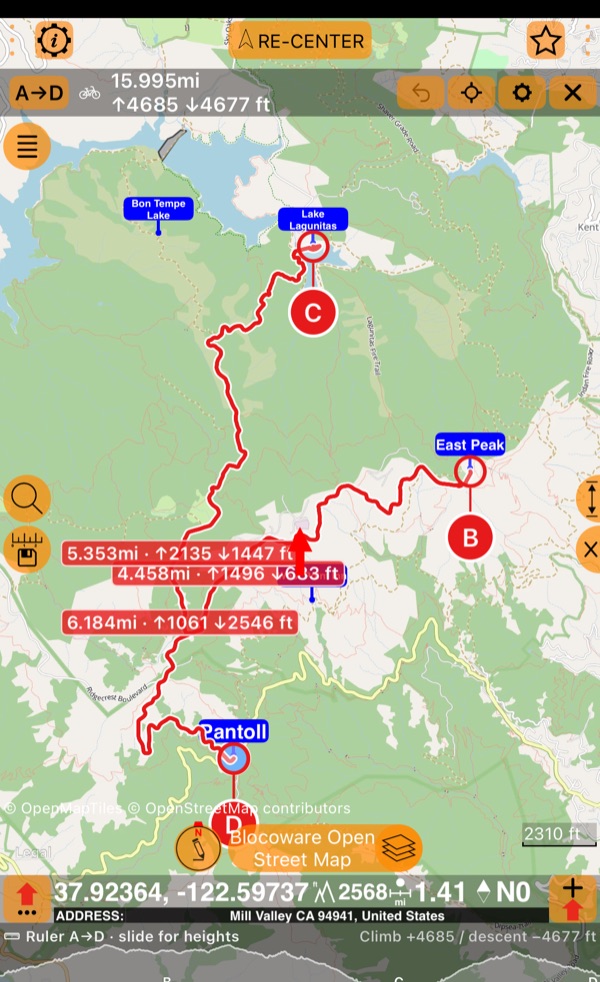
Before you go, plan it. Tap out your way with the ruler : in a straight line, as you fly or sail, or along the roads and trails for how you travel. It draws the profile of the land along your way and gives every leg its distance and the land’s ascent and descent, so you can plan your effort leg by leg before you set off.
On the way, pace yourself. Don’t burn out halfway up: the Climb panel shows how steep it is right now, how much of the climb you have already done, and how far and how high it still is to the top, so you know when to hold back and when to give it everything.
Make it a race. Beat your own best, or the friend who dared to send you their track: in the Ghost race the ghost sets off with you, and the gap shows live, second by second.
Listen to your body. Watch your Bluetooth heart rate and cadence live on the way, and now, if you want, keep them with the track and the video. Afterwards the chart shows how hard your heart worked on every climb and whether your cadence kept your knees safe, and the readings become videos of their own , to lay over your action cam footage or to show off.
Afterwards, find where it hurt. A total says little about the day; the map and the chart show all of it. Colour the route by speed, altitude, gradient or heart rate, and the hard parts light up on the map; drag along the chart and read the grade, the steepest 100 m and your climbing rate at any point of a climb , with your heart rate beside them. You see where you lost speed, where your heart hit its limit, and what to do differently next time.
Then watch yourself get better. One good day proves nothing; a trend does. Every climb of your track is measured and set against every time you did it before , with your best and your trend; a race shows the very spot where you won or lost the seconds; and your pauses and the places the GPS lost you are marked, so the numbers are honest. Now you can see that you are getting faster, and by how much.
Keep it all as a book . The route, your waypoints, the pinned tracks and the maps with their offline tiles in one file: one tap to focus on the trip, one file to share, or to keep as a backup. Look for inspiration in the book library : open a sample, and see how it is made.
Do more with fewer taps. No digging through menus while you move: the side toolbar puts the tools you reach for most one tap from the dashboard, on the side of any iPhone and iPad, and you adjust them to the task in hand: the track, the video and a waypoint, or your target, heading and altitude, in the order you want. And on the iPhone Duo we don’t let a single pixel go to waste: the toolbar lives in its vertical bar, and every screen of the app is fitted to the new display.
Side toolbar: one tap from the dashboard
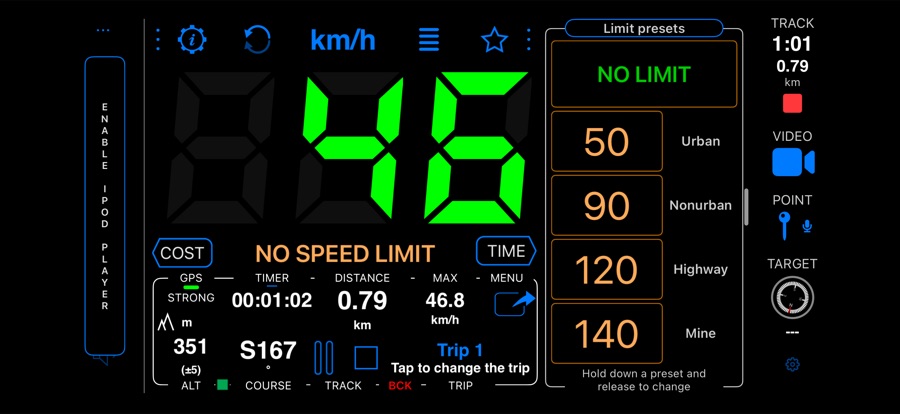
Start a track, a video or a waypoint without opening the menu, and keep your target,
heading or altitude in view while you ride. You choose the tools and their order,
from TRACK, VIDEO and POINT to HUD, TARGET, COMPASS and ALT. On other iPhones
and iPads, turn it on in Settings,
MENU > Settings > Advanced settings > Side toolbar, and it shows in landscape; on the
iPhone Duo it is on by default. In Speedometer 55 Free, the TRACK
and POINT tools show a lock until you
upgrade
.
Made for the iPhone Duo
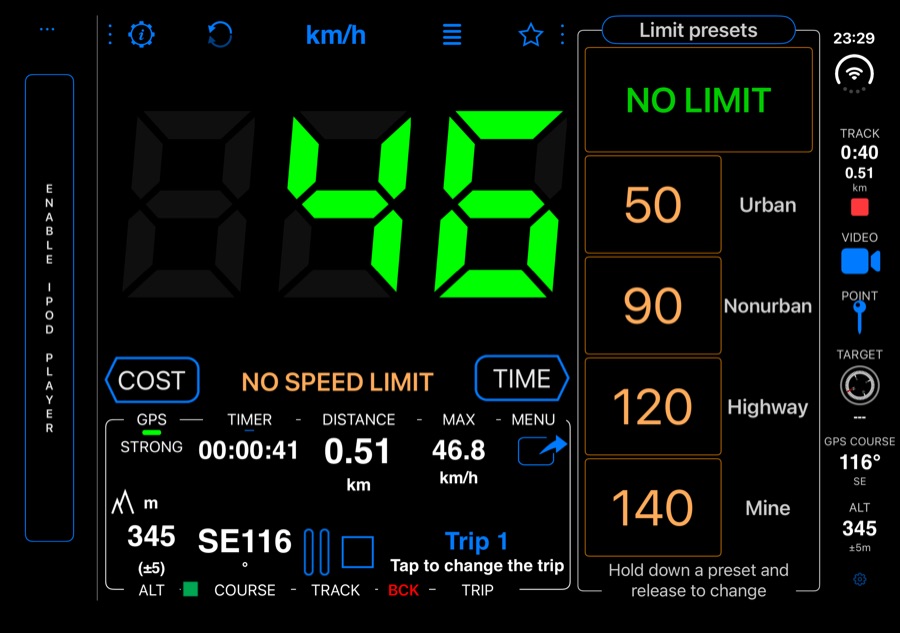
On the iPhone Duo the vertical bar beside the screen is no longer empty: the side toolbar is on there by default, with the phone closed or open and in every orientation, with the tools you choose (in Speedometer 55 Free, TRACK and POINT need Full PRO ). Around it, the app was gone through screen by screen for the Duo:
- Lists and settings stop at the vertical bar: their section headers, separators, search fields and footers no longer run underneath it.
- The dashboard’s corners, the menu and the HUD keep clear of the bar and the camera, in every pose.
- Screens follow when you fold or unfold the phone: the mileage calculator, the waypoint list and the track screen keep their full width.
The side toolbar on the iPhone Duo.
Climb: how steep is it, and how far to the top? PRO
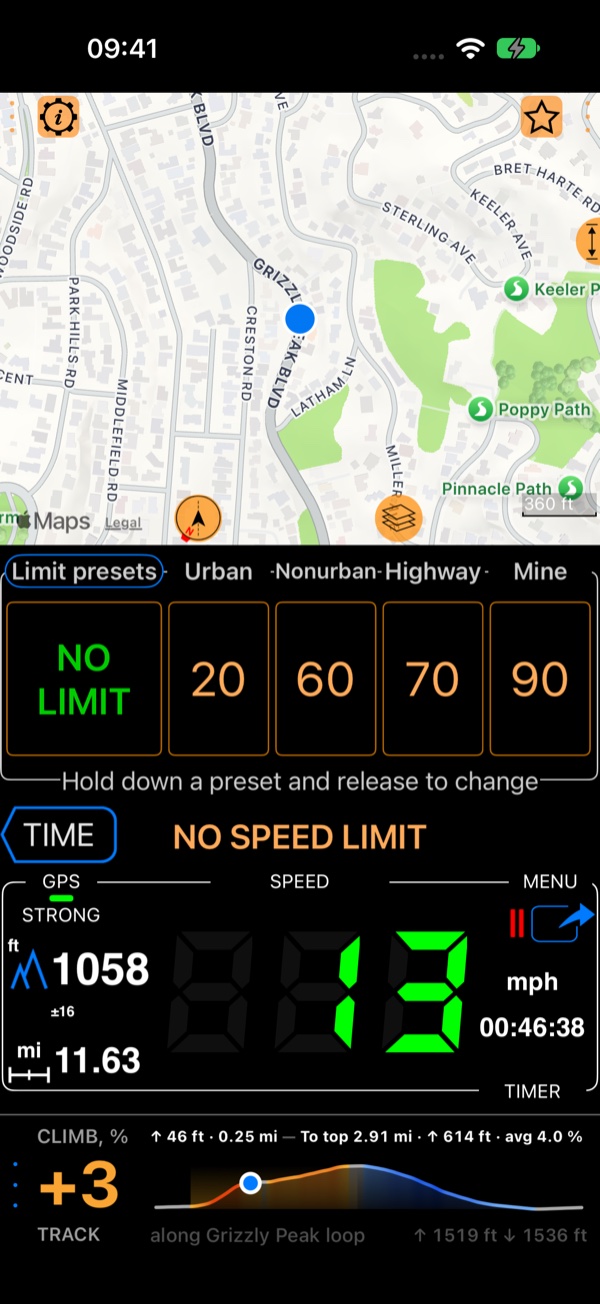
The Climb panel answers while you ride: the grade under your wheels, this climb so far, and, along a track you pick, how far and how high it is to the top, with the profile ahead. Put it in a panel, in the centre Cycling panel, or along the map.
- The climbs of a recorded ride — the Climb and Climb by climb panels find every climb in a track and measure each one: its length, height, average and steepest 100 m, and its time.
- Am I getting faster up this hill? — compare a climb with every ride up it, see your best, and keep all your climbs in My climbs.
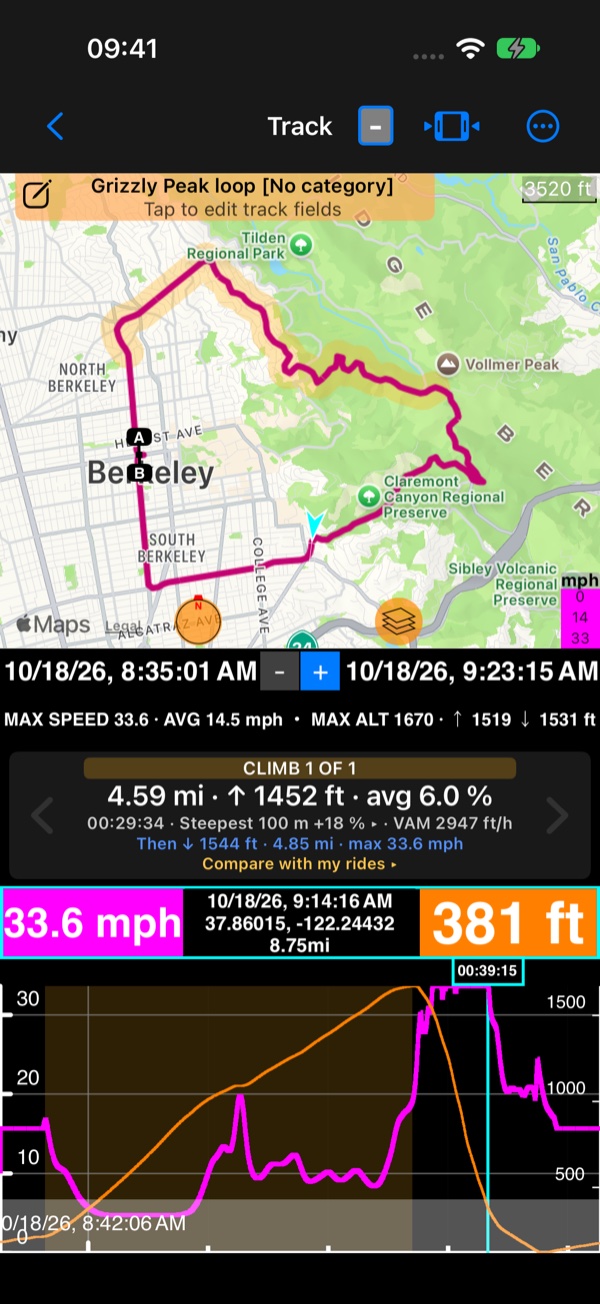
More on the live Climb. · The climbs of a recorded ride. · Your climbs over time.
Ghost race: can I beat my last ride? PRO
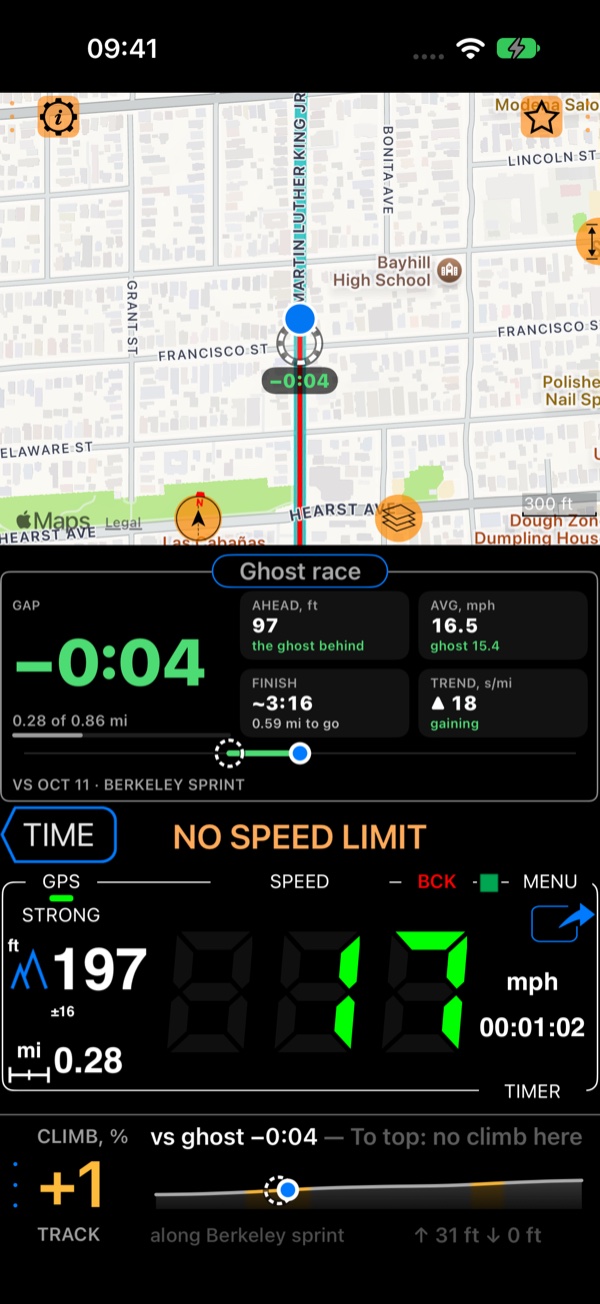
Pick a track you have recorded, ride to its start and tap Start: the ride’s ghost sets off with you, exactly as you rode it then. All the way round you see whether you are ahead or behind, by how many seconds and how far, and at the end you get your time and the final gap. By bike, board or car.
Every race is kept with the track it recorded, so afterwards you can see where you won it and where you lost time.
More on the Ghost race. · Analyze a race.
Ruler: how far is it, really? PRO
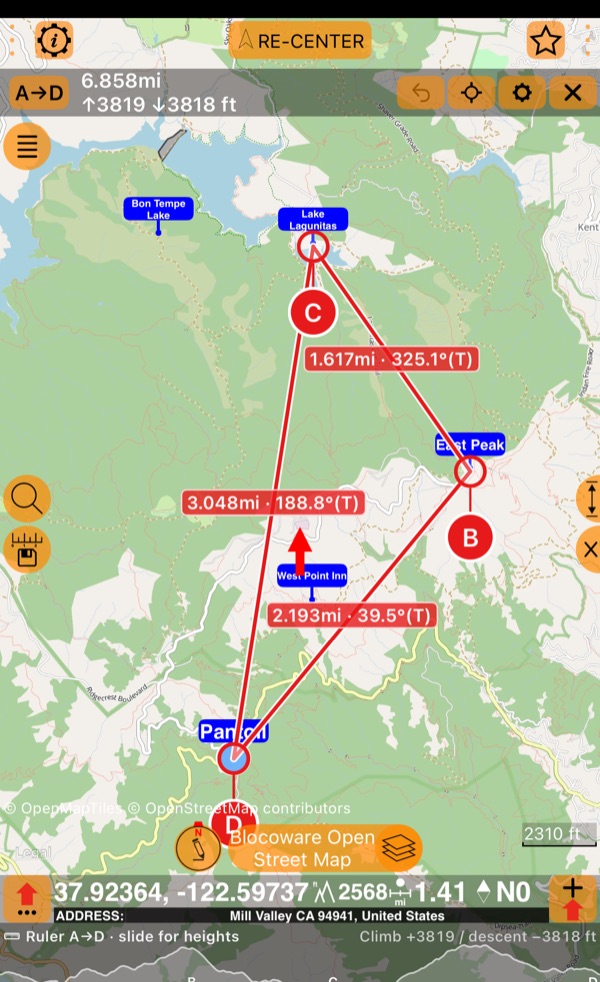
Tap a point on the map and read the distance, the bearing and the climb as the crow flies. Keep tapping to plan a loop, let the legs follow the roads and trails for how you travel, slide along the elevation profile, and keep the plan as a route book.
Books: everything one trip needs, in one file PRO
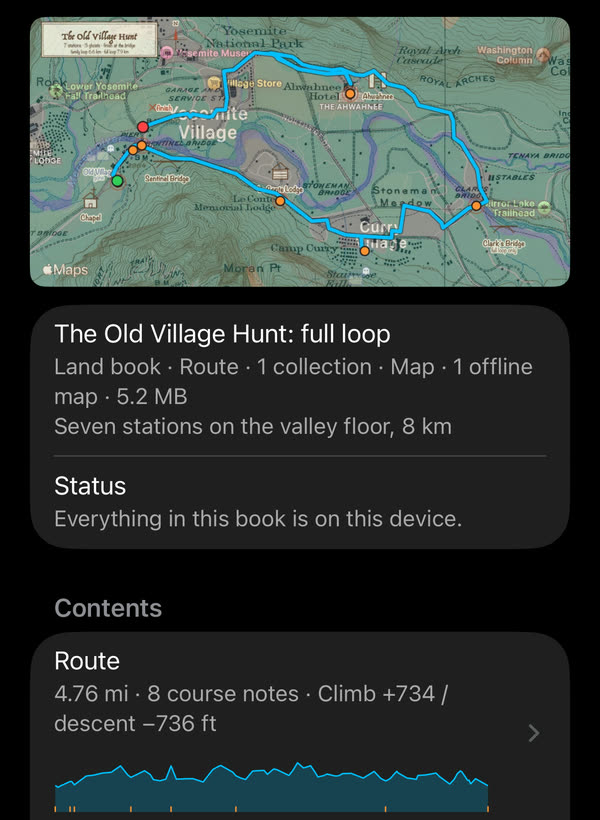
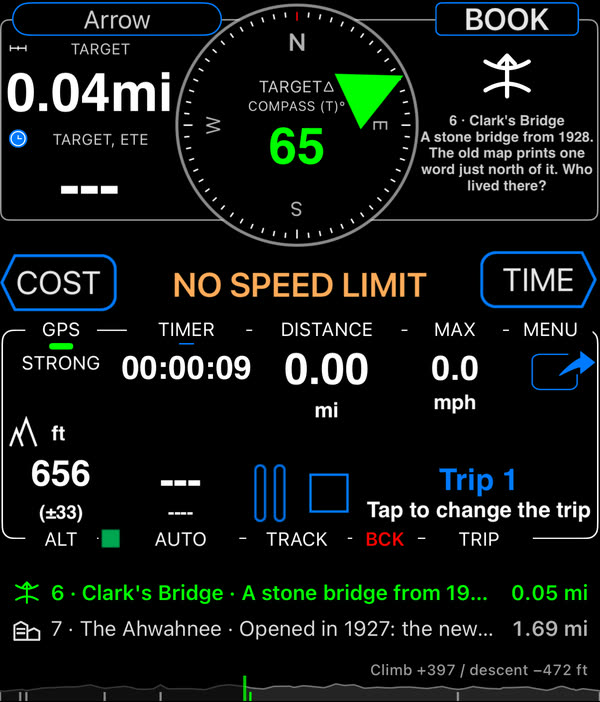
A book packs a trip into a single file: a route with its course notes, waypoint
collections (camps, fuel stops, zones to avoid), the tracks you want on the map, and
the map itself, with its offline tiles and ground image overlays. Make one from what
is on your phone, run it with the compass arrow on the next course note and the notes
read aloud, and share it. Your rallies from the
Rally computer
are on the same shelf, as road books. Open MENU > Books, or start with a sample from
the
book library
.
More on books. · The book library.
Bluetooth sensors, recorded and on video PRO
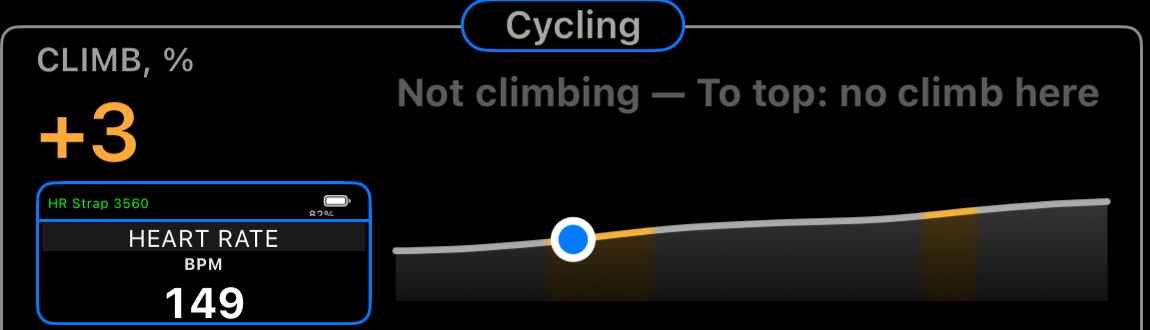
Heart rate, cadence and wheel speed from the Bluetooth panel no longer end on the screen. No watch needed:
- Recorded with every track: on the chart beside speed and altitude, as route colours on the map, in the stats, and in GPX exports for Strava, Garmin Connect and other tools.
- On video: live on the camera, stamped into the recording, and exported as transparent overlay videos, from a video or from a track.
- In the Cycling panel: a sensor’s card in one of its two places, beside the climb.
- They stay connected: a saved sensor connects by itself when it shows up again, and stays connected on every screen while a track records.
More on Bluetooth sensors. · Bluetooth sensors on video.
Breaks in a track: your pauses and your GPS reception PRO
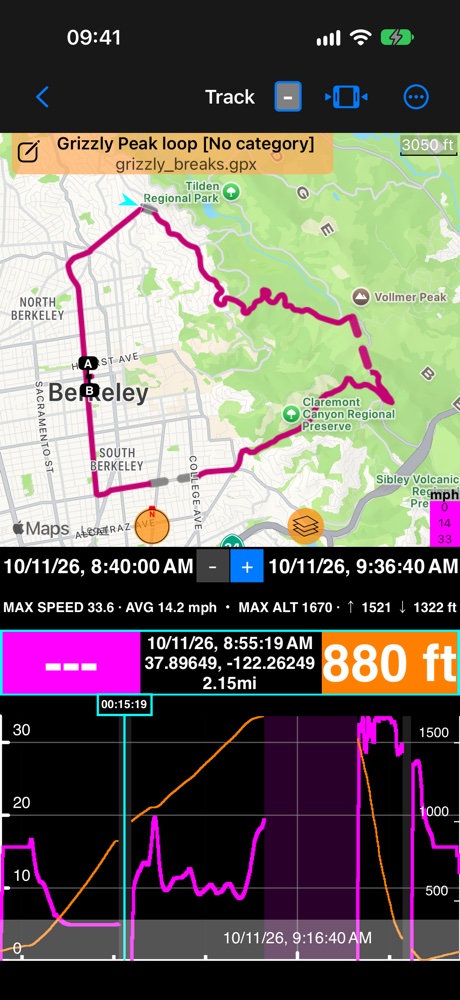
Where did I pause? Where did the GPS lose reception, and for how long? A track now keeps its breaks, and shows them: on the chart as a gray band where there was no position and a light magenta band for a pause, and on the map, with Breaks in a track set to Dashed, as a dashed line across the part that was not recorded. The climbs and the totals use only what was measured.
Upgrade to Speedometer 55 Full PRO
Speedometer 55 Free gets the side toolbar and everything made for the iPhone Duo; of the toolbar’s tools, TRACK and POINT need Full PRO. Climb, the Ghost race, the ruler, books, Bluetooth sensors, and the breaks in a track are in Speedometer 55 Full PRO , a separate, one-time paid app with no subscription.
Get Speedometer 55 Full PRO on the App Store
Related
- Side toolbar
- Climb · Climbs of a recorded ride · Your climbs over time
- Ghost race · Analyze a race
- Ruler
- Books · Book library
- Bluetooth sensors · Bluetooth sensors on video · Track data
- Breaks in a track
- What’s new in version 6.4
❤️ Enjoying the app and its updates? Please consider leaving a rating—it means the world to us!