How to Measure and Compare Road Surface Quality
This guide walks you through measuring whether one lane, section, or resurfaced route is actually smoother, then documenting the comparison in a report you can share. In Speedometer 55, this workflow uses Road Survey.
What this tutorial is for
Use this tutorial when you want to answer a practical question such as:
- Which lane is smoother on the same road?
- Did resurfacing or patching actually improve this section?
- Is this route segment rougher than the previous one?
- Which repeated run gives the better surface result under comparable conditions?
This tutorial follows one rule: keep the device setup stable and change only the road, lane, or condition you actually want to compare.
Before you start
Set up the run so the comparison will mean something.
- mount the phone rigidly
- keep the phone in the same position and holder for all compared runs
- use the same vehicle if possible
- drive the compared sections at similar speeds when practical
- change only one comparison variable at a time
Good single-variable examples:
- left lane vs right lane on the same stretch
- before resurfacing vs after resurfacing
- dry run vs wet run on the same section
- one street section vs another section with the same mounting setup
Bad comparison examples:
- changing route, speed, and mount at the same time
- comparing one short urban section with one long mixed section
- re-running the route with the phone mounted differently without recording that change
Step 1: Prepare the settings
Open MENU > Modes > Engineering > Road Survey.
In settings, start with the built-in Road Survey preset unless you already have a tested custom preset for the same vehicle and mount.
For the first useful run, only check these settings:
PresetMax session durationShow saved session details prompt
Use a duration long enough to finish the section you want to compare.
Keep the saved-session details prompt on. You will want to record the lane, section, surface state, or weather while the run is still fresh.
Do not begin by changing score weights or alert tuning. First collect one clean baseline with the default Road Survey profile.
Step 2: Run the baseline session
The baseline is your reference run for the section or lane you want to compare against later.
Suggested flow:
- open
Road Survey - confirm the
Road Surveypreset is selected - tap
START - if asked, start a new track or join the current one intentionally
- drive the chosen section in a normal, repeatable way
- tap
STOP - save the session
When the saved-session details prompt appears, label the run clearly.
Recommended fields to fill:
Test labelMounting locationOperating conditionNote
Good baseline labels:
Main Street baseline right laneRing road before resurfacingBridge approach dry baselineSection A normal traffic
Good notes:
Same speed target as comparison runRigid windshield mountDry surface, light trafficRepeated reference section
Step 3: Change one thing and run the comparison session
Now change one comparison variable only.
Examples:
- switch to the other lane on the same stretch
- re-run the same section after repair or resurfacing
- compare one road segment against another with the same setup
- repeat the same section under different surface conditions
Then repeat the same run pattern:
- start a new Road Survey session
- use the same mount and phone position
- keep speed and driving style as similar as practical
- stop and save
- label the session clearly
Good comparison labels:
Main Street comparison left laneRing road after resurfacingBridge approach wet runSection B same setup
If multiple things changed and you did not record them, the comparison becomes much weaker. The report may still be readable, but it will not answer a clean question.
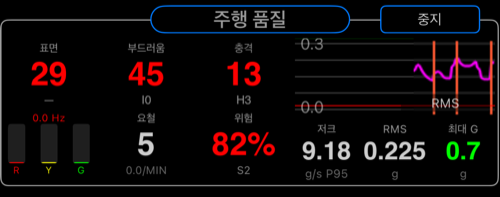
Step 4: Read the results in a useful order
Do not start with every number at once. Read the sessions in this order:
Overall scoreImpact scoreStability score
A practical reading model for Road Survey:
- worse
Impact scoreusually means harsher bumps, sharper hits, or stronger road defects - worse
Stability scoreusually means more persistent roughness, vibration, or uneven texture through the run - if
Overall scorechanged a lot whileImpact scorestayed similar, the section may feel broadly rougher rather than just more severe on isolated hits
Then look deeper only if needed:
- compare the channel balance if one direction or axis seems to dominate
- review event behavior if one section felt harsher than the score alone suggests
- check labels and notes before drawing conclusions about why the score changed
Step 5: Compare the sessions
Use the saved sessions as a comparison set, not as isolated runs.
A good comparison answers:
- which lane or section scored better overall?
- which run had stronger impact problems?
- which run showed more persistent roughness?
- is the difference large enough to matter for maintenance, routing, or documentation?
Examples:
- if one lane has a clearly worse impact score, it likely contains more harsh defects or isolated hits
- if one section has similar impact but worse stability, it may be broadly rougher without a few standout hits
- if resurfacing improves both channels, the repair likely produced a meaningful quality gain
This is why clear labels matter. Without them, you may remember that one result was worse, but not whether it was the left lane, the patched section, or the wet-weather repeat.
Step 6: Generate a report
Generate a report only after the sessions are labeled properly.
A useful report should make these points obvious:
- which sections or lanes were tested
- whether the runs were before and after, or side by side
- which run is the baseline
- which run performed better and in what way
The report becomes much more useful if:
- both sessions use clear section or lane labels
- the mount and phone position stayed the same
- the comparison variable is obvious from the note
- the route sections are genuinely comparable
Use reports when you want to:
- document a road-quality comparison
- show before-and-after repair results
- share a repeatable survey result with a teammate
- keep a record of which section or lane performed worse
Step 7: Share the result
Share after the sessions and report are understandable on their own.
Before sharing, check:
- the session names clearly identify the compared sections
- the notes explain the surface or operating condition briefly
- the report reflects the comparison you actually intended
A shared report is most useful when the receiver can understand what was compared without needing your memory of the drive.
Common mistakes
- changing mount position between compared runs
- comparing sections driven at clearly different speeds without noting it
- forgetting to label the baseline clearly
- comparing runs with very different route length or traffic conditions
- trying to compare before-and-after work without recording which is which
Good first experiment
If you want one reliable first Road Survey test, do this:
- Run 1: right lane of a known rough section
- Run 2: left lane of the same section
- Compare
Impact scorefirst - Then compare
Stability score - Generate one report and share it
That gives you one clean answer quickly: which lane or section gives the better ride quality under the same setup?