Compass 55. Track data
Every track keeps more than a line on a map. Open a track (MENU → Tracks, tap the track) and the track screen tells the story of the ride or the walk: where you went, how fast, how high, and where it got hard.
Speed and altitude on one chart
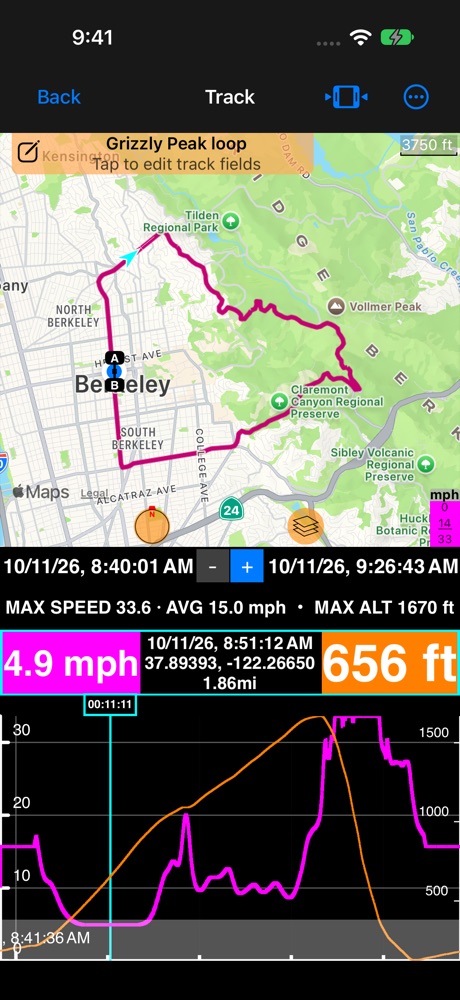
Speed (magenta, left axis) and altitude (orange, right axis) share the chart, each on its own scale. Slide along the chart: the light blue cursor moves, the arrow on the map follows, and the two readout boxes show the values at that moment. Pinch or drag on the chart to zoom into part of the track; the line under the dates gives the maximum and average for what you see.
Bands mark the breaks in the track : gray where there was no position (the GPS lost reception, or the app was closed), light magenta for a pause. A dashed altitude line means the height was not measured there.
Pick what the screen shows
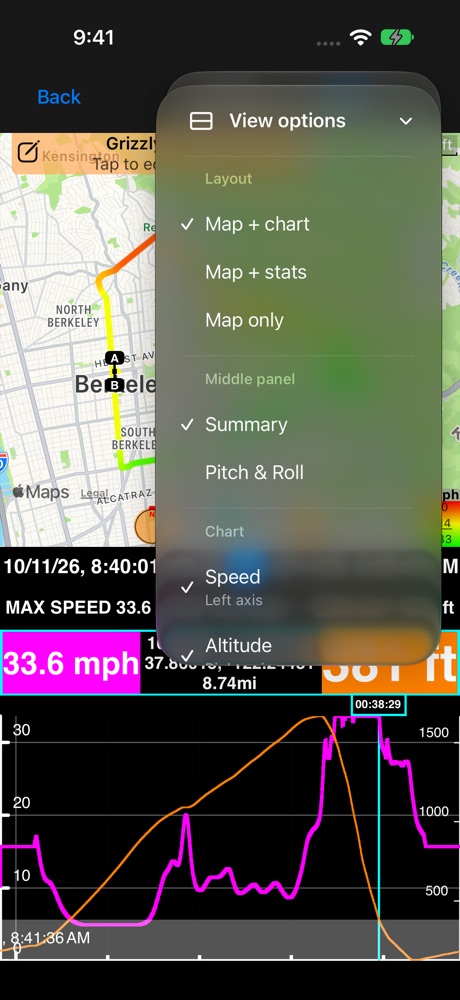
More → View options has three short sections:
- Layout: Map + chart, Map + stats, or Map only.
- Middle panel: Summary (the line with the maximum and average) or Pitch & Roll, when the track was recorded with motion data.
- Chart: up to two series. The first goes on the left axis, the second on the right; picking a third replaces the older one. The chart keeps your choice for the next track.
Color the route
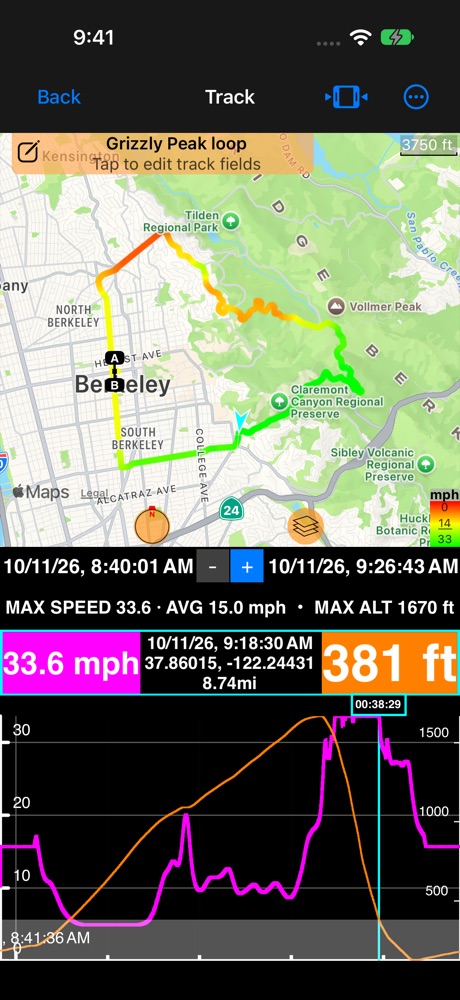
Tap the color legend in the map’s corner and choose Speed or Altitude. Slow parts turn red, fast parts green, so you see at once where the ride got hard. The app remembers your choice.
The steepest moment
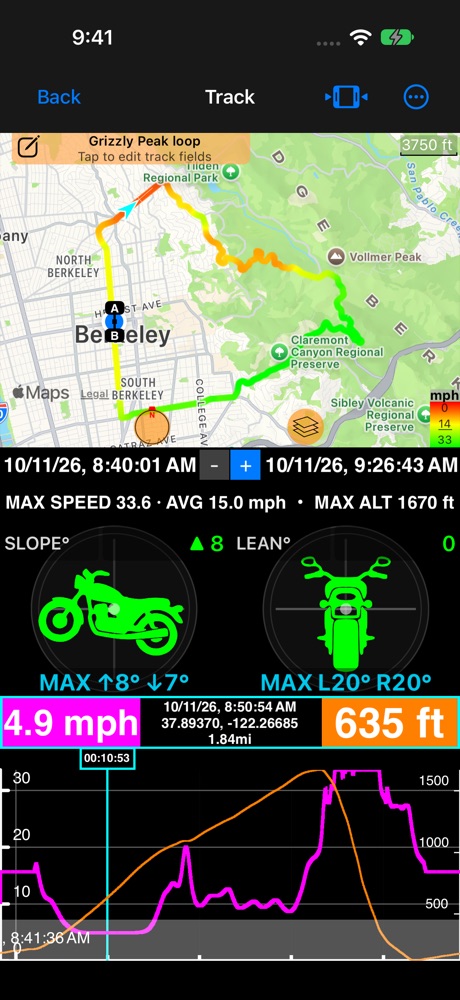
When the track was recorded with motion data (Settings → Tracking → Include motion and audio), choose Pitch & Roll as the middle panel. The instrument follows the cursor, and its MAX row shows the steepest values of the whole track. Tap one of them to jump straight to that moment, on the chart and on the map.
The whole ride in numbers
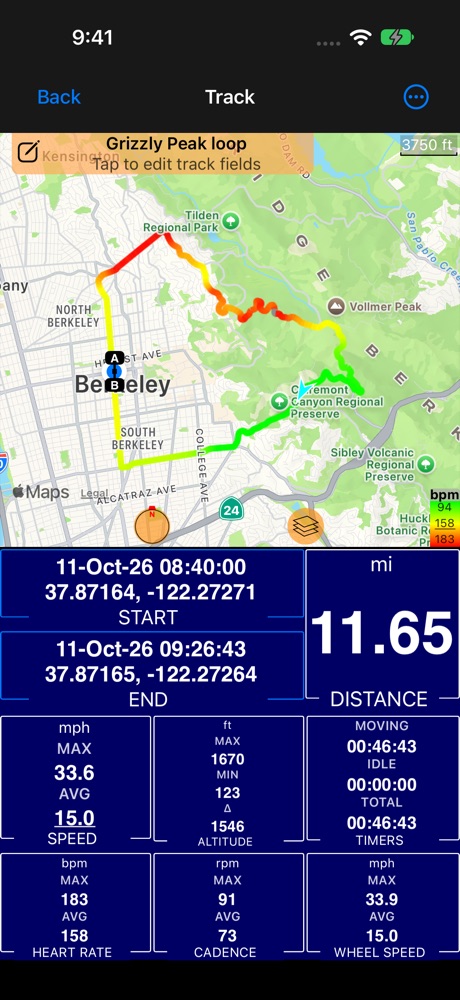
Map + stats sums the track up: distance, start and end, maximum and average speed, the highest and lowest point and the climb, and the moving and total time.
Bluetooth sensors
The Bluetooth panel has shown your sensors live for a while. In the public beta, connect them ( how ) and they join every track: heart rate from a chest strap, cadence from a crank sensor and wheel speed from a hub sensor. They are recorded with the track, on the phone, with no watch needed, and show up everywhere the track does.
Turn it on once. Open MENU, then the settings button inside the NEW TRACK button, and scroll to Motion and audio data. Record Bluetooth sensors is on from the start. With it on, a track records every sensor that is connected while it runs. Before you start, the NEW TRACK button’s summary lists Sensors among what will be captured. Recording never asks for Bluetooth access by itself: it uses the sensors you have already connected.
- A sensor connected mid-track starts recording from that moment, without restarting the track.
- A sensor that drops out (out of range, a strap taken off) leaves a gap. The chart breaks there instead of drawing a straight line, and the sensor joins again by itself when it is back.
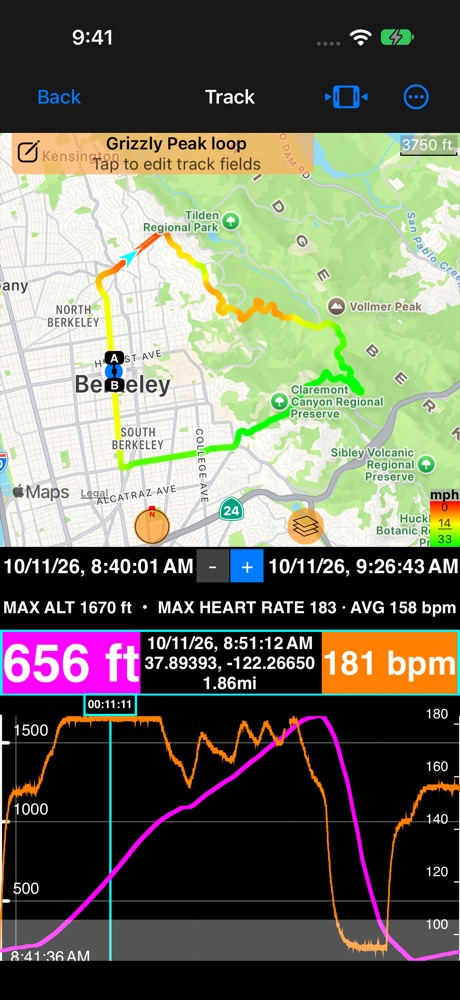
Chart heart rate, cadence or wheel speed beside speed and altitude (More → View options → Chart). Only the sensors a track recorded are offered. The readout boxes show the value at the cursor, for example “175 bpm” or “90 rpm”.
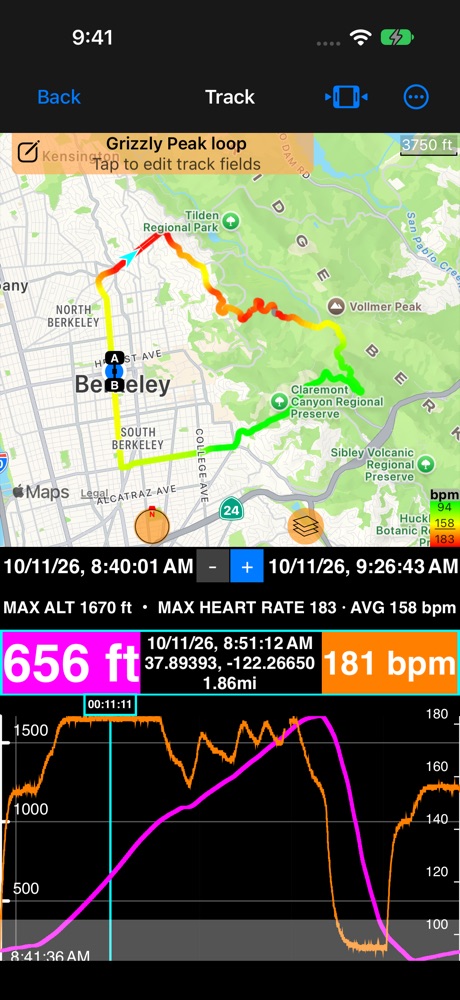
Color the route by heart rate, cadence or wheel speed: tap the color legend in the map’s corner ( Tracks colored by speed, altitude or your sensors ).
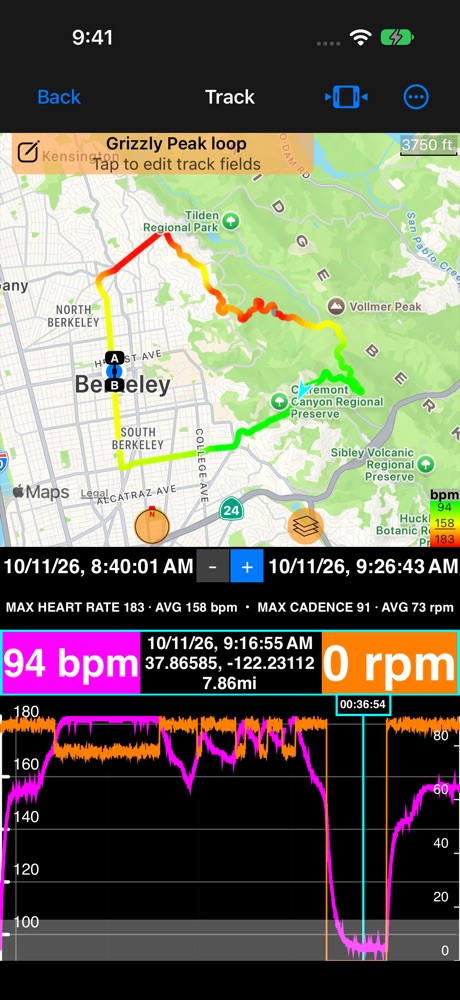
See where you stopped pedalling: cadence drops to zero on the descent while your heart comes down.
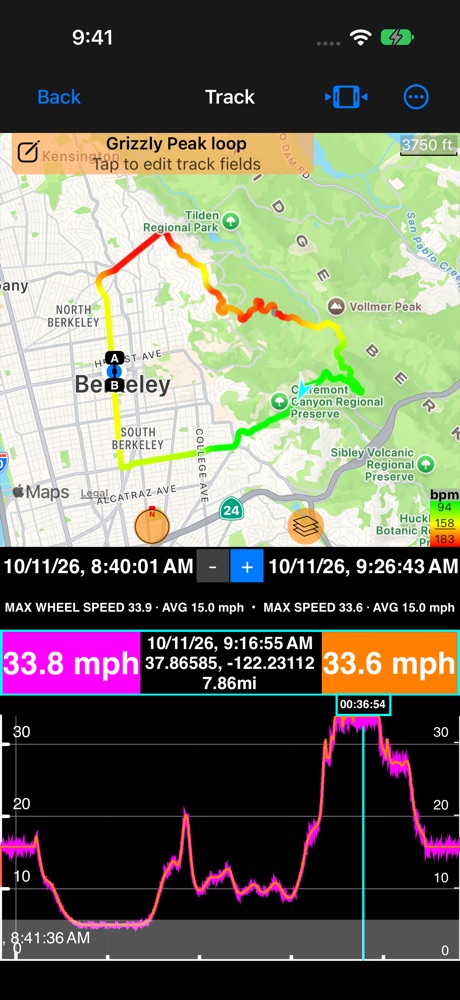
Wheel speed from the hub sits right on top of GPS speed, and keeps going where GPS can’t: in tunnels, under trees, on a trainer.
Also:
- Stats: a row with the maximum and average for every sensor.
- Tracks list: with notes shown, a track’s note row ends with a heart for heart rate and a cyclist for cadence or wheel speed.
- Trimming a track trims its sensor data too, and the stats follow at once.
- Delete the sensor data alone: More → Recorded data → Delete sensor data removes it and keeps the track and any motion data.
- GPX: exports carry heart rate and cadence for Strava, Garmin Connect and other tools. Importing a GPX that has them brings them in too.
- Trip archive: a trip saved as an archive keeps the sensor data with each track.
- Overlay videos: heart rate, cadence and wheel speed can be exported as overlay videos from the track ( Overlay videos from a track ).
Related: Map + speed and altitude chart ▪︎ Map + stats ▪︎ Map only ▪︎ Tracks colored by speed or altitude ▪︎ Bluetooth sensors
