Tracks colored by speed or altitude.
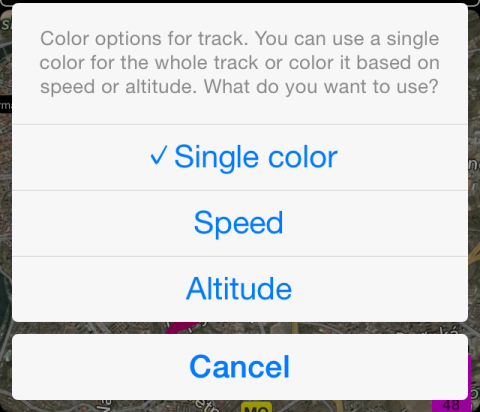
Recorded tracks can be shown on a map colored by speed or altitude. Tap on a violet box with min, average and max speed values to open track coloring options.
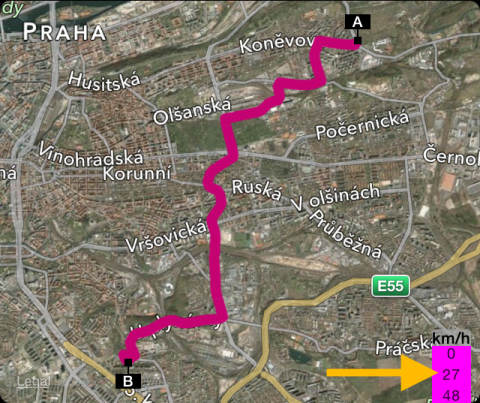
Here is how speed colored track looks like:

And the same track, colored by altitude:

Related information:
How to pin a track to a map to retrace it later?
Climb gradient and your sensors
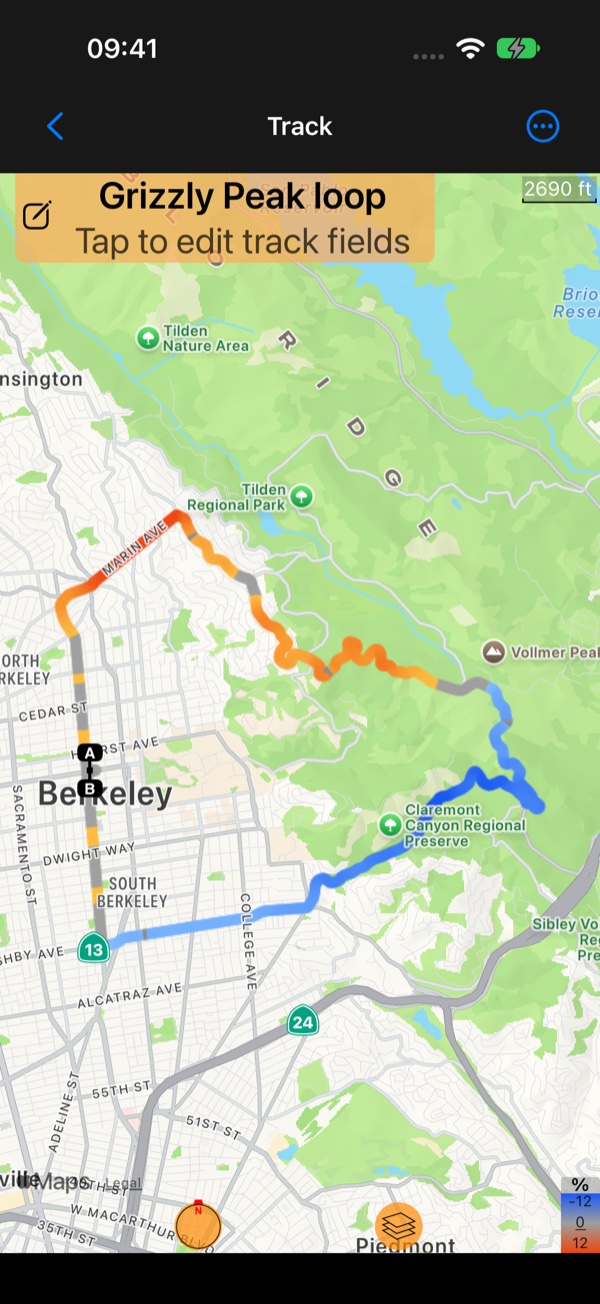
In the public beta the colour options offer more than speed and altitude:
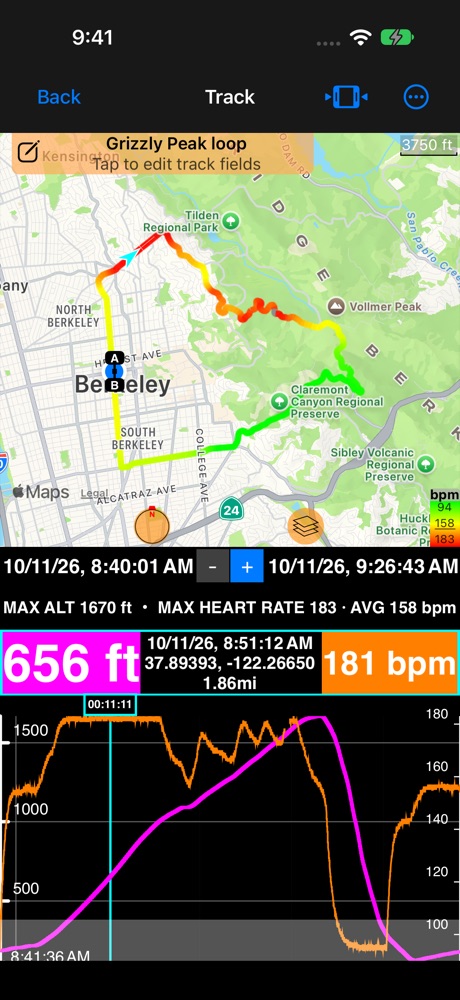
Climb gradient: the track amber where the road climbs and blue where it descends, so every climb of a ride shows at a glance. See Where were the climbs on my ride? .Heart rate,Cadence,Wheel speed: on a track recorded with your Bluetooth sensors, the track coloured by what they measured.
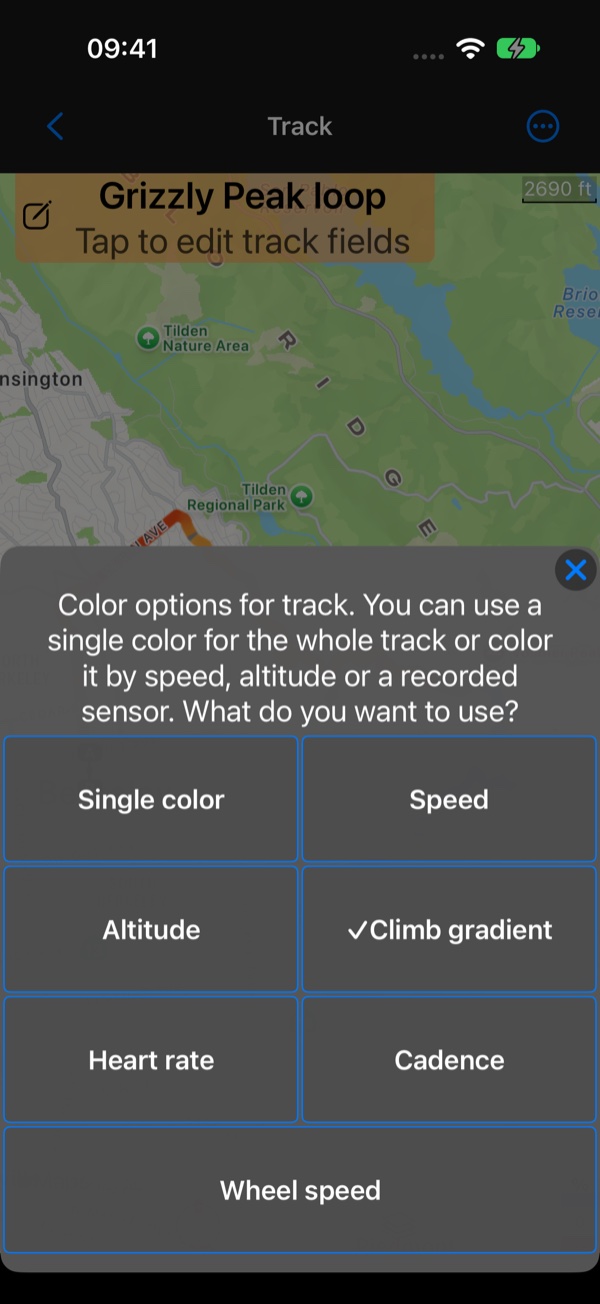
Heart rate, cadence and wheel speed
The three sensor colours are offered only for a track that recorded that sensor:
Heart rateandCadenceshow effort: green where it was easy, through yellow, to red where it was hard.Wheel speeduses the speed colours: red where you were slow, green where you were fast.- The scale runs between the track’s own lowest and highest value, around its average. The legend in the map’s corner shows the three, in bpm, rpm or your speed unit.
- Where the sensor had no reading (out of range, a strap taken off), the track is grey, so a gap never looks easy. That gray runs along the track; a gray dashed line joining two ends is a break in the recording instead ( Breaks in a track ).
See Bluetooth sensors for connecting them and recording them with your tracks.
