Where were the climbs on my ride?
How steep was that wall, how long was the climb, and how fast did I go up? Open a recorded track: the Climb and Climb by climb panels find the climbs in it and measure each one.
To show them, open the track, tap View options at the top of the screen, and under Middle panel choose Climb or
Climb by climb.
The Climb panel
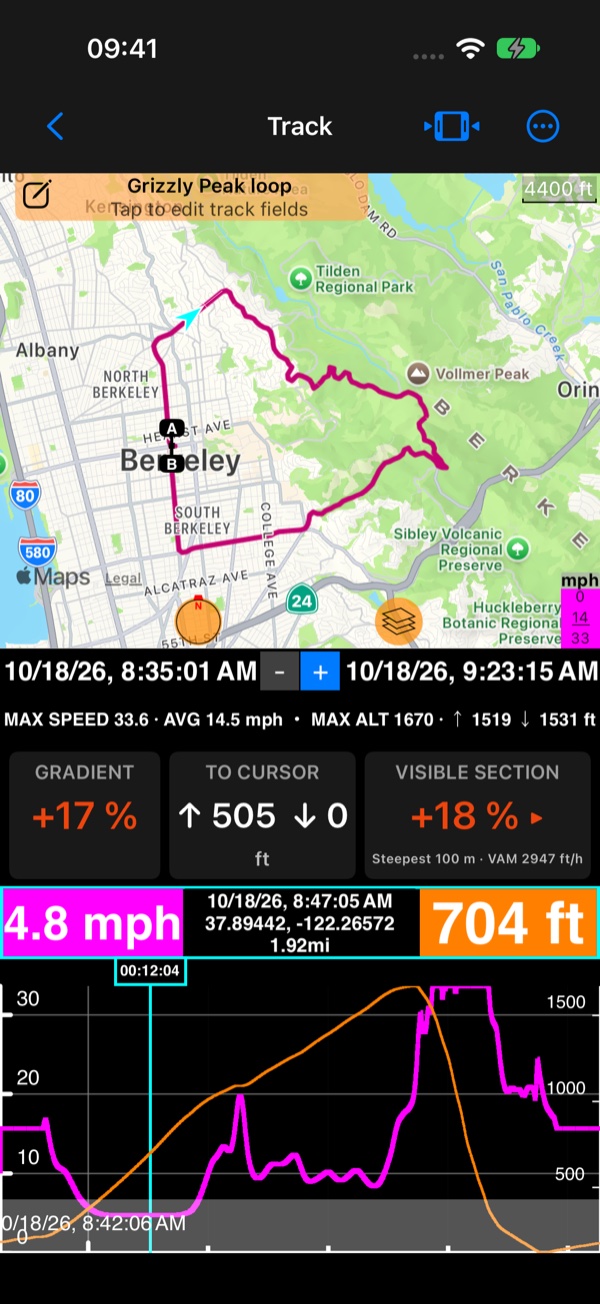
- GRADIENT: the grade at the chart’s cursor. Drag along the chart to read it anywhere on the ride.
- TO CURSOR: the height climbed and descended from the start of the visible section to the cursor.
- VISIBLE SECTION: the steepest 100 m of what the chart shows, and the climbing rate (VAM: height gained an hour). Tap it to jump there.
Climb by climb
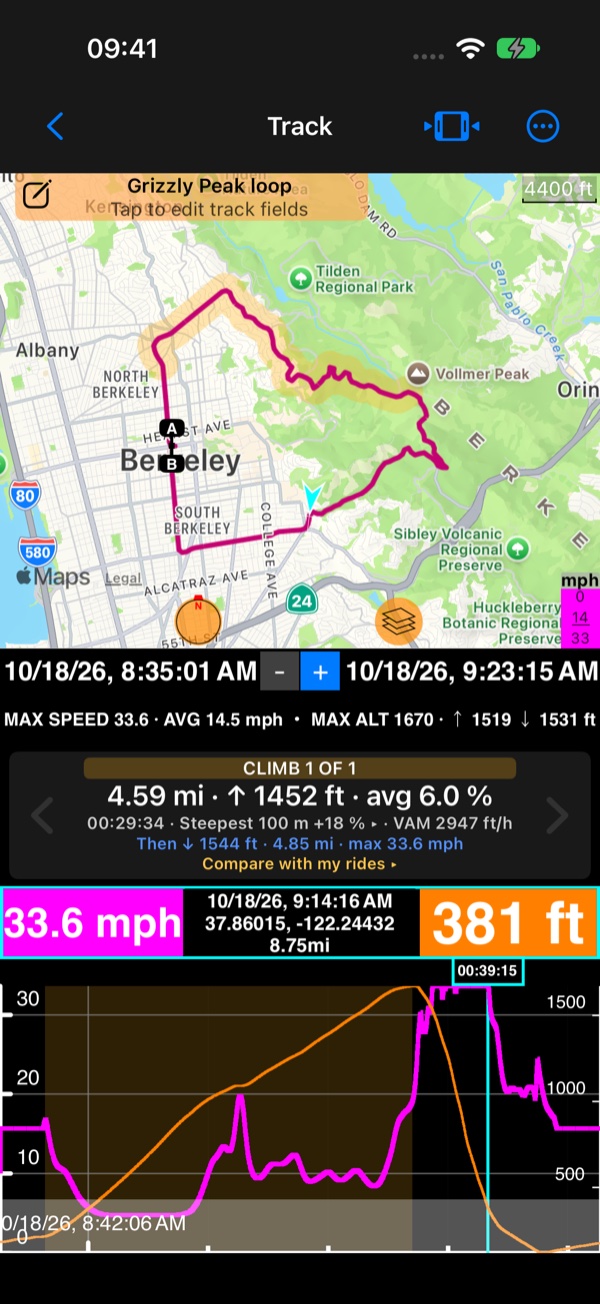
Every climb the app finds in the ride, one at a time: “CLIMB 1 OF 1”, its length, height gained and average grade, the
time it took, the steepest 100 m and the climbing rate, then the descent after its top. ‹ and › step between the
climbs: the chart zooms to the climb, and the map draws it in amber.
A climb stops at a break in the recording (a pause, the app closed, or a GPS loss that covered some ground), and the next one can start after it: see Breaks in a track .
Compare with my rides ▸ sets this climb against every other ride up it: see
Am I getting faster up this hill?
.
The gradient on the chart
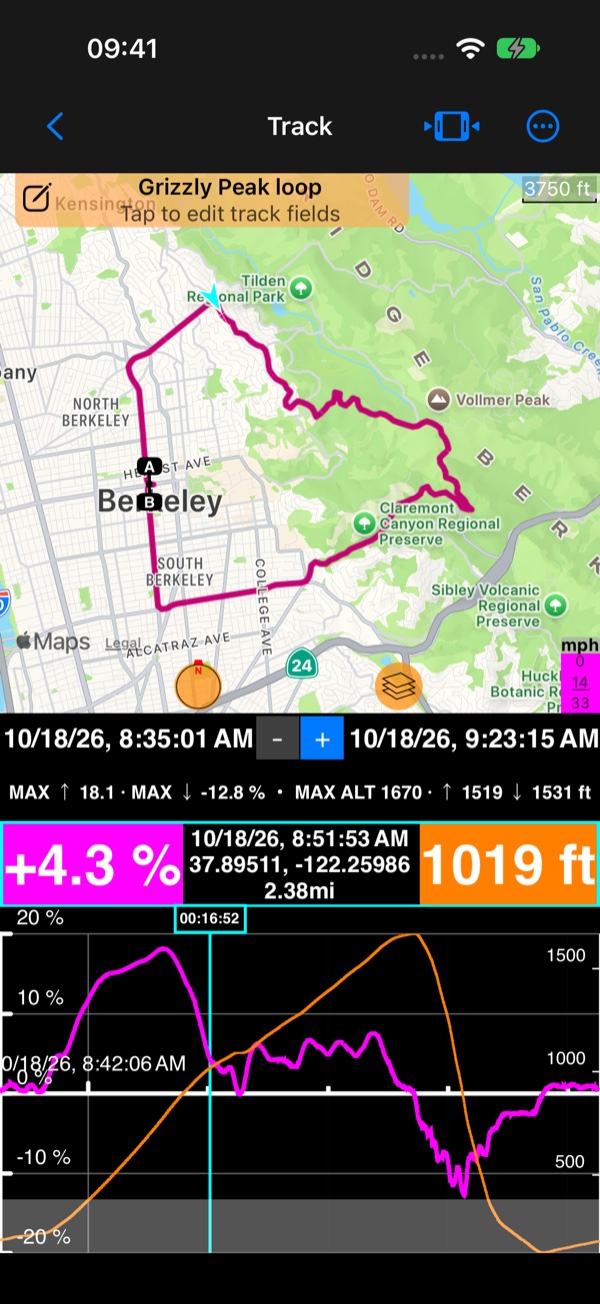
In View options › Chart, pick Climb gradient: the chart draws the road’s grade along the ride, next to the altitude
or the speed. Under Horizontal axis you can lay the chart out by distance instead of time, so a climb’s length reads
straight off it.
The track coloured by its gradient
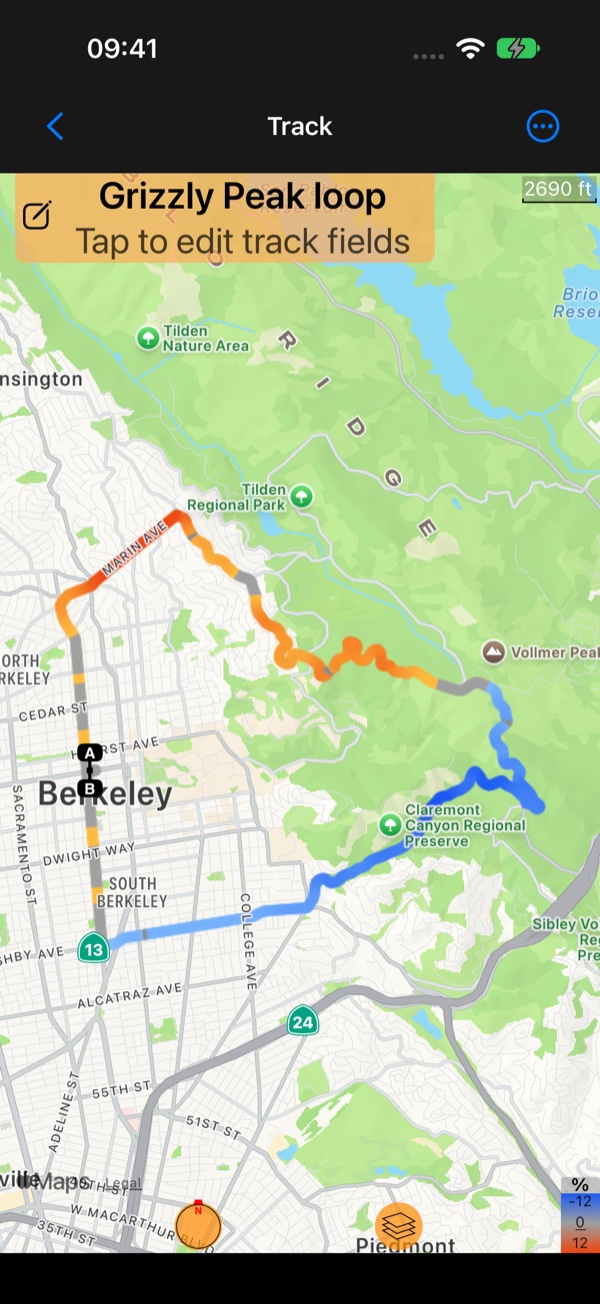
On the track’s map, tap the colour box (it shows the track’s lowest, average and highest value) and choose
Climb gradient: the track turns amber where it climbs and blue where it descends, deeper the steeper, so every climb
of the ride shows at a glance. Apple maps colour tracks; Google maps cannot. See also
Tracks colored by speed or altitude
.
Video
▶ How hard was that climb? Your ride remembers : the climb of a recorded ride, on the chart and on the map.
More videos: Compass 55 tutorials